
A device-financing bundle looks like a straightforward growth opportunity: combine a device and a mobile service, spread the payment and make the purchase easier. But the marketing question is more demanding than who might say yes. A customer can welcome an offer and still struggle to sustain it. Another can remain loyal to a provider without wanting a financed device at all.
The TeleMarket case starts with that tension. It considers an initial rollout using an existing customer dataset rather than assuming the whole customer base should receive the same offer. The aim is to make growth decisions more deliberate by examining engagement, relationship history, past marketing responses and financial indicators together.
This is an exploratory customer analytics case, not evidence of a completed commercial rollout. Its strongest lesson is that response, retention and repayment are different outcomes. A useful decision process needs to preserve those distinctions even when the same customer data are relevant to all three.
Begin with the decision, then define the outcome
The case dataset contains 4,500 records. The available fields span demographics, income and debt indicators, technology ownership, service usage, tenure and responses to three previous offers. This is a richer starting point than a simple demographic segment because it includes behaviour and the history of a customer relationship.
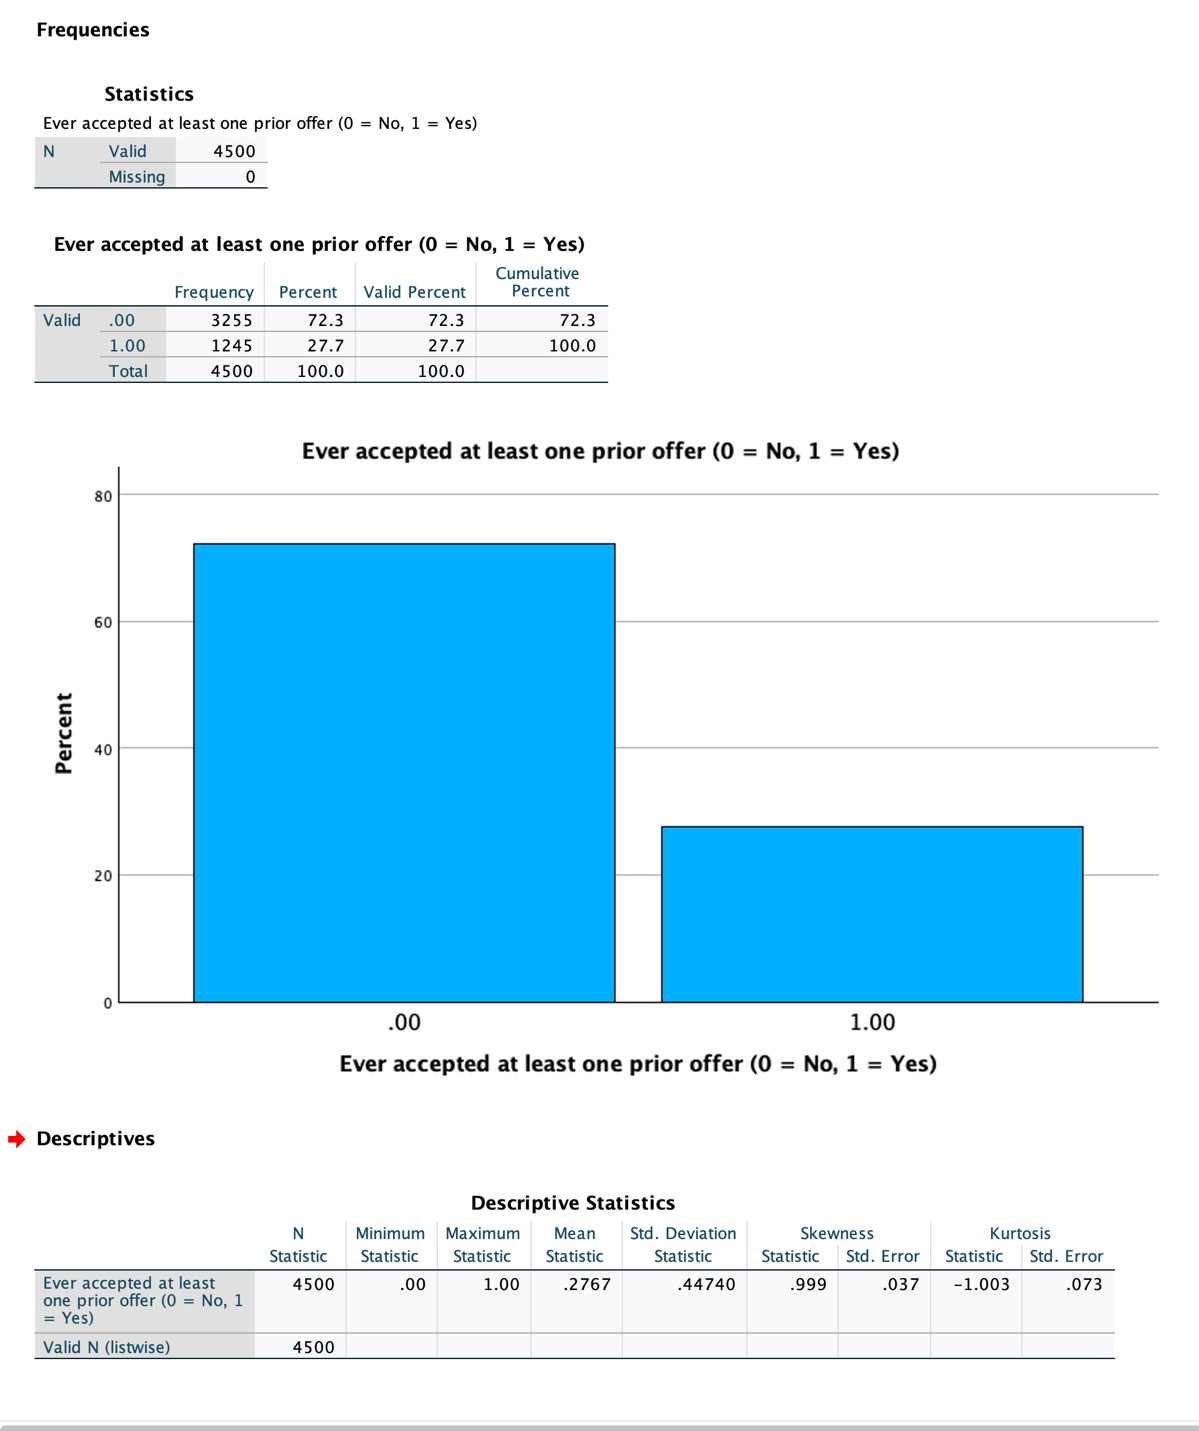
For marketing responsiveness, the analysis constructs a binary outcome: a customer who accepted at least one of the three previous offers is coded as a responder; someone who accepted none is coded as a non-responder. In the reported data, 27.7% accepted at least one offer. That tells us about past response under the circumstances of those campaigns.
It does not directly measure demand for a new device-financing bundle. The previous offers may have differed in price, relevance, timing and commitment. Using past response as a practical indicator of openness is reasonable as a hypothesis, but the gap between that proxy and the new decision must remain visible.
The same discipline applies to churn. Remaining with a telecom provider and repaying financing are related business concerns, but one is not a substitute for the other. A churn model can support relationship management without establishing creditworthiness. A response model can help prioritise a marketing test without becoming an approval rule.
Simplify engagement without hiding what it means
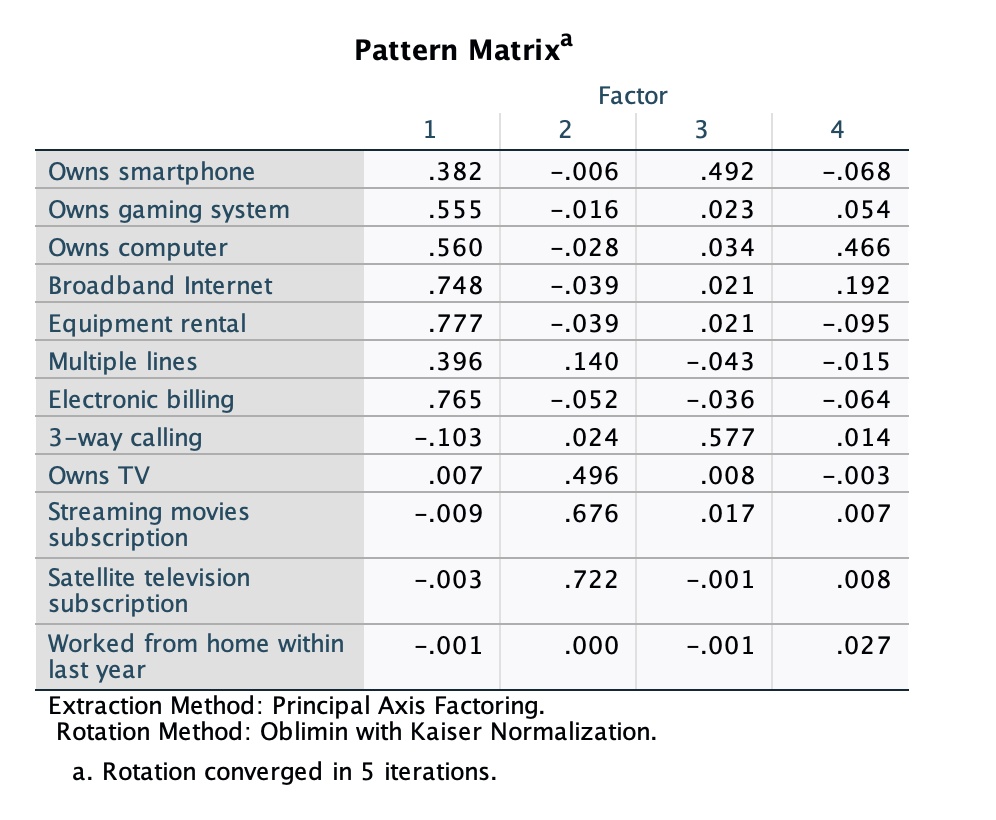
The dataset includes several measures of technology ownership and service use. Including many overlapping variables can make an analysis difficult to interpret. Factor analysis was used to investigate whether these behaviours could be summarised into broader engagement dimensions.
The source analysis reports a Kaiser–Meyer–Olkin value of 0.823 and a statistically significant Bartlett test. These are checks on whether the variables share enough information for factor analysis to be useful. They support examining a reduced structure; they do not establish that the resulting score measures loyalty, repayment capacity or willingness to purchase a particular bundle (Hair et al., 2019).
This is where business interpretation matters. A score based on devices and services might indicate familiarity with technology, the breadth of a household's subscriptions or the intensity of use. The factor loadings and the underlying variables need to justify its name. Calling it engagement should be the conclusion of that examination, not a shortcut around it.
The case also develops a simpler composite technology score for a later selection filter. That operational score and the statistical factor score should be documented separately. They may serve related purposes, but changing how a measure is constructed can change who is selected.
What the reported model results can and cannot establish
Logistic regression is used in the case to work with binary outcomes and produce probability-based rankings. It offers an interpretable way to examine associations, provided the outcome, coding and predictors are specified consistently (Hosmer, Lemeshow, & Sturdivant, 2013).
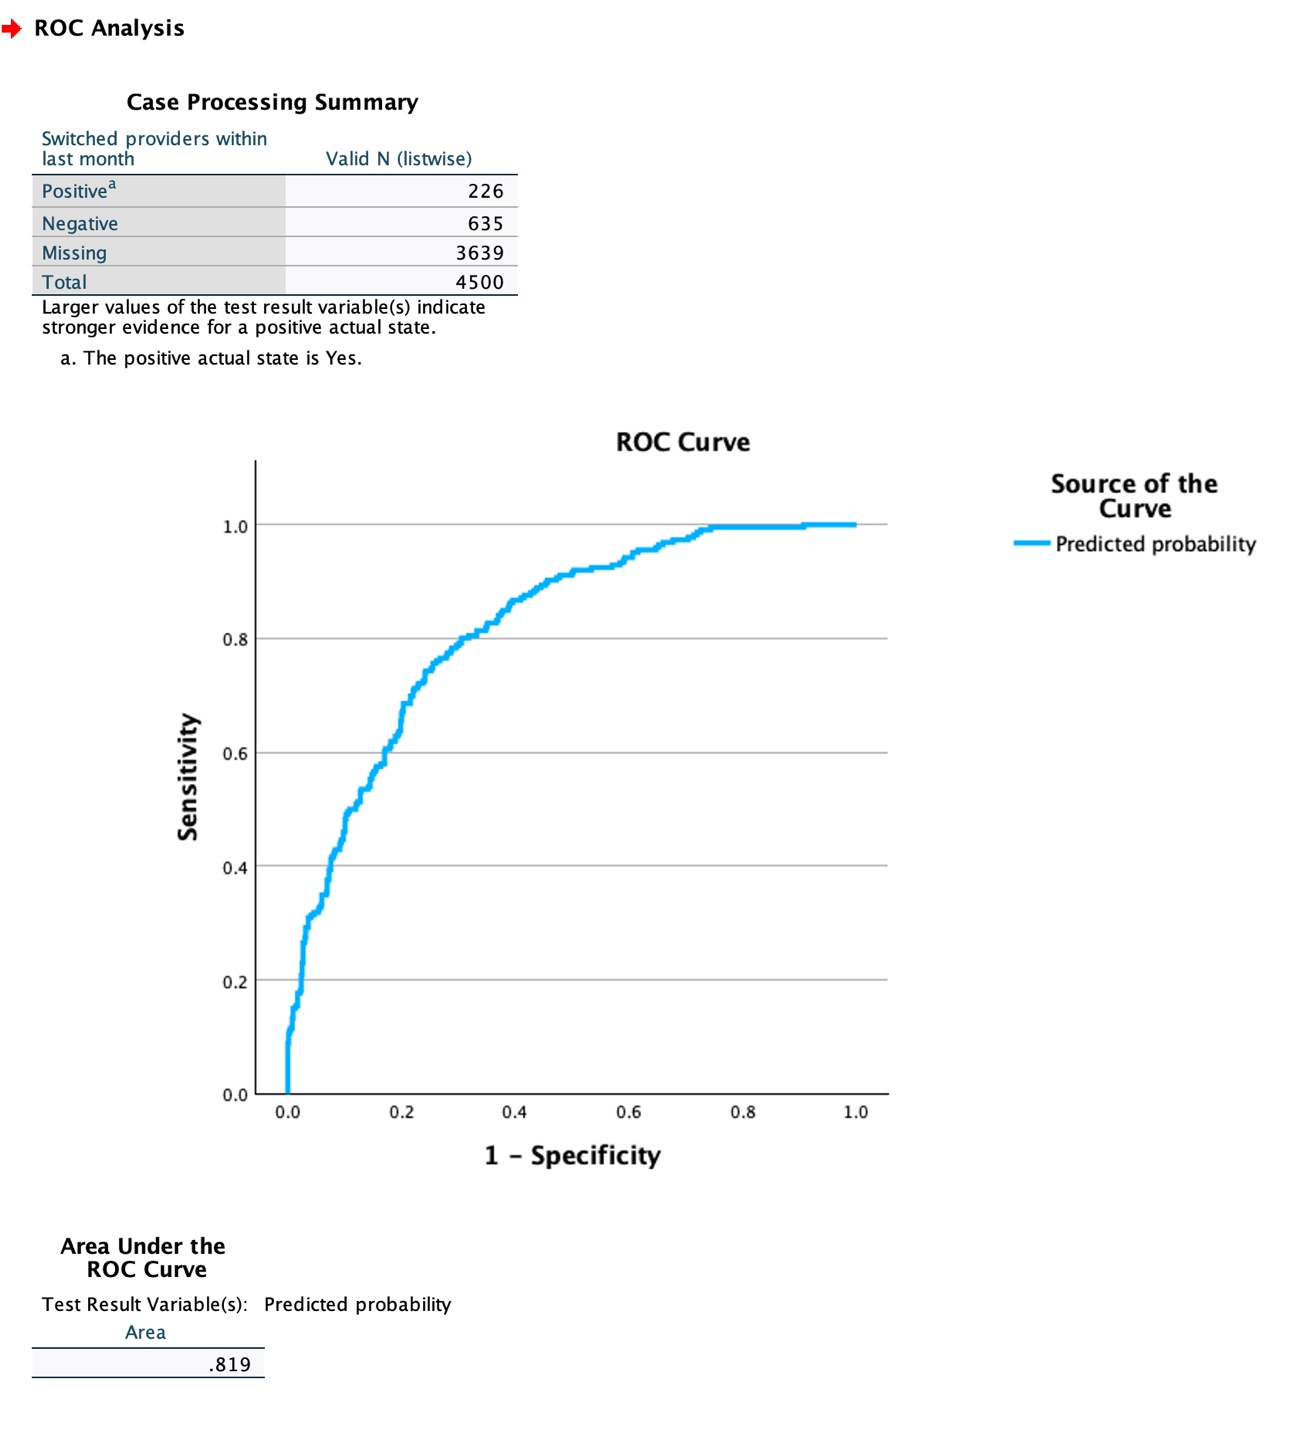
The reported diagnostics include an omnibus test below .001, a Nagelkerke pseudo-R-squared of 0.176, a Hosmer–Lemeshow p-value of .174 and an area under the ROC curve of .819. Taken at face value, these describe aspects of the fitted analysis: improvement relative to an intercept-only model, a measure of fit, a calibration check and a ranking measure. They answer different questions and should not be collapsed into a single claim that the model is validated.
The crucial distinction appears in the original statistical output: the regression models whether a customer switched providers within the last month, with No coded as zero and Yes as one. The accompanying narrative also discusses prior response and financing suitability, but these are not the outcome of that displayed model. The model therefore concerns churn, not repayment or acceptance of the proposed bundle.
An AUC of .819, for example, concerns the ordering of observations with respect to the outcome actually modelled. It is not an 81.9% repayment rate, an acceptance probability or evidence that selected customers are safe borrowers. Moreover, the supplied ROC output lists 861 valid observations and 3,639 missing, while the regression output lists 4,500 included cases. That difference needs explanation before treating the curve as a performance assessment of the full fitted sample. ROC analysis helps evaluate discrimination; it does not supply a business objective or a credit decision (Fawcett, 2006).
Reading the event coding also changes the interpretation of the coefficients. In the displayed churn model, technology engagement has an odds ratio of 1.330, credit card debt .935 and previous loan default 2.114. These correspond to higher, lower and higher odds of the recorded switching event, respectively, conditional on the other included predictors. They do not establish that engagement improves retention or that any of these variables predicts repayment. A persuasive business interpretation must follow the output rather than reverse its direction.
Use relationship patterns to ask better questions
The descriptive part of the case examines tenure alongside churn and customers' stated reasons for choosing TeleMarket. It reports shorter tenure among customers who left and a pattern of weaker stability among those who joined primarily for price. These observations suggest useful questions about early customer experience, perceived value and the durability of promotional acquisition.
They do not establish that price-sensitive customers are poor credit risks, or that longer tenure guarantees a successful financing relationship. A customer can choose a good price for sensible reasons. Treating an acquisition motive as an automatic exclusion would turn a descriptive pattern into a judgement the analysis has not demonstrated.
The more productive use of these observations is to investigate what happens early in the relationship. Are customers receiving the service they expected? Do they understand the ongoing price? Are there avoidable service problems? The answer may improve retention before any financing offer is introduced.
Translate analysis into a testable rollout
The original case proposes beginning with a narrow segment and expanding in stages. That logic remains useful, provided the selection criteria are treated as hypotheses to evaluate. Marketing responsiveness, relationship stability and any financing eligibility assessment should have distinct roles in the process.
One illustrative filter in the case combines technology ownership, an income condition, no recorded previous default and prior offer response. It selects 122 records, or approximately 2.7% of the dataset. This is the output of a defined rule. It does not show that those customers would accept the new offer, repay it or outperform an alternative selection method.
The distinction matters because a precise customer count can look more authoritative than the reasoning behind it. Every additional condition narrows the selected group. The question is whether that narrowing improves the outcome the business actually values, and whether useful customers are being excluded without evidence.
A phased test would therefore need clear decision criteria before expansion. Initial interest and uptake are only the beginning. Subsequent service retention, repayment behaviour, complaints, servicing costs and the customer experience would all help determine whether the proposition works. An eligible comparison group would help separate the effect of the offer from the characteristics customers already possessed.
The source suggests expanding through ranked groups, potentially changing the offer as learning accumulates. Such changes would themselves need evaluation: different terms can alter both demand and customer outcomes. A ranking is a tool for structuring a test, not an instruction to expand automatically.
Growth that the evidence can support
Customer lifetime value is a useful reminder to look beyond the initial sale. Revenue has to be considered alongside the costs of acquisition, service and a continuing relationship (Gupta & Lehmann, 2005). A financing bundle that creates an attractive launch figure can still fail to create durable value.
The TeleMarket case points toward a disciplined approach: define the outcome, examine the data, simplify carefully, interpret the model in the right direction and learn from a bounded rollout. Its limitations are part of the argument. Customer analytics becomes more valuable when it makes the uncertainty in a decision visible, rather than giving several different questions the same reassuring score.

References.
- Fawcett, T. (2006). An introduction to ROC analysis. Pattern Recognition Letters, 27(8), 861–874. https://doi.org/10.1016/j.patrec.2005.10.010
- Gupta, S., & Lehmann, D. R. (2005). Managing customers as investments: The strategic value of customers in the long run. Wharton School Publishing.
- Hair, J. F., Black, W. C., Babin, B. J., & Anderson, R. E. (2019). Multivariate data analysis (8th ed.). Cengage Learning.
- Hosmer, D. W., Lemeshow, S., & Sturdivant, R. X. (2013). Applied logistic regression (3rd ed.). Wiley.